Manchester Earthquake Sequence, October-November 2002
Last revised: 04/11/2002
Introduction
Since the morning
of October 21, a relatively large number of earthquakes have been
felt in the Greater Manchester area. At this time more than 70 earthquakes
have been recorded on the British Geological Survey (BGS) seismograph
network, 27 of which were reported felt. Minor damage has been reported
for the largest event in the sequence, which can occur for earthquakes
of this size. The first earthquake
that was felt occurred on 21 October at 07:45:15 (UTC) with a magnitude
3.2 ML. This was closely followed by a smaller event of 2.3 ML at
08:04:58. A few hours later at 11:42:34, there was a magnitude 3.9
ML earthquake, the largest recorded so far, which was strongly felt
throughout the Greater Manchester area. About 22 seconds later was
another earthquake with a magnitude 3.5 ML. Prior to those events,
two earthquakes were recorded by the BGS seismograph stations on October
19 and one event on October 21 at 07:29:20. These three events were
not felt. The activity has continued to the present time (complete
list of events), however, the size and frequency of events has decreased. While it appears
somewhat unusual to get that many earthquakes within only a few days,
this has been previously observed in the UK. Such earthquake sequences
can occur in two ways. Firstly, moderate to large size earthquakes
are usually followed by aftershocks, which occur due to readjustment
to a new state of stress. The pattern of the aftershock sequence depends
on the size of the event and the local tectonic setting. Normally,
the largest aftershock is about one magnitude unit smaller than the
main shock. For example, the magnitude 5.4 ML Lleyn Peninsula earthquake
that occurred in North Wales in 1984 was followed by some 25 aftershocks
in the subsequent two months, the largest of which was a magnitude
4.3 ML earthquake that occurred one month later. Secondly, earthquake
swarms are sequences of earthquakes clustered in time and space without
a clear distinction of main shock and aftershocks. Examples of such
swarm activity in the UK are Comrie (1788-1801, 1839-46), Glenalmond
(1970-72), Doune (1997) and Blackford (1997-98, 2000-01) in central
Scotland, Constantine (1981, 1986, 1992-4) in Cornwall, and Johnstonbridge
(mid1980s) and Dumfries (1991,1999) in the Borders. The Manchester sequence
appears to be an earthquake swarm, since the difference in magnitude
between the largest event in the sequence and the other events is
not as significant as expected in a main shock � aftershock sequence.
However, most of the energy during the sequence was actually released
in the double-event on October 21 at 11:42. The clustering of these
events in time and space does suggest that there is a causal relationship
between the events of the sequence. Monitoring
Permanent Stations
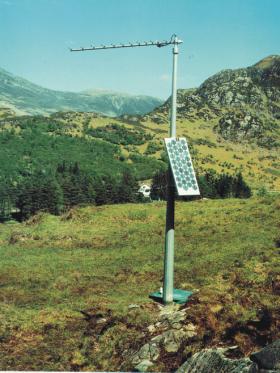
The BGS operates a seismograph network
of 146 stations distributed over the UK (station map). The field stations
consist of a seismometer, a modulator and a radio for data transmission
(Figure 1). These sites are typically in remote locations since the
seismometers are sensitive to extremely small ground movements. The
data from groups of sensors are transmitted to a number of central
recording sites and continuously recorded on a computer. In the next
stage, the data are collected and processed at the BGS in Edinburgh.
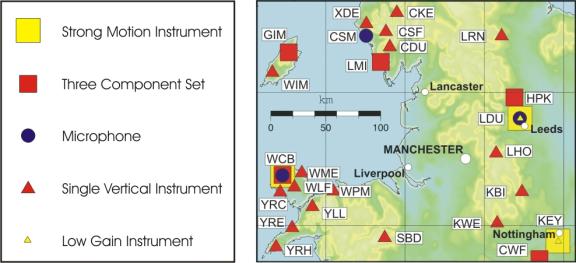
The nearest networks to Manchester earthquakes are installed around
Leeds and Keyworth as well as in North Wales and Cumbria (Figure 2).
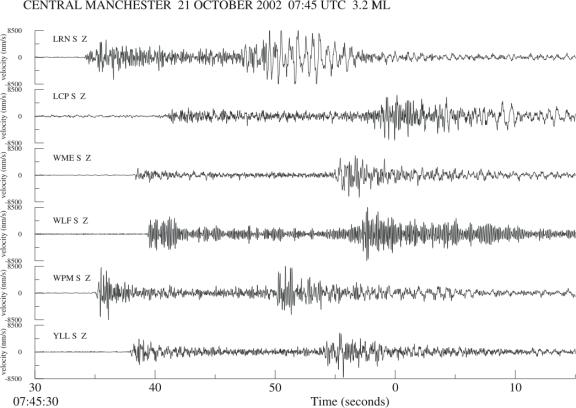
Sample seismograms are shown in Figure 3.
Deployment of Temporary Stations
The permanent network
of seismograph stations operated by BGS allows determination of origin
times, epicenters and depths of the Manchester earthquakes. However,
the nearest seismograph station is approximately 24 km from the center
of Manchester, so to better determine depth and epicenter and to better
understand the relationship between seismicity and local geology,
the BGS have installed three temporary seismograph stations around
Manchester (Figure 4). The closest of the temporary stations to the
earthquake epicenters is situated at Manchester University. This will
provide crucial information on how deep below the surface the focus
of the earthquake is. The other two stations are positioned to complement
the permanent stations to the east and southeast to maximize azimuthal
coverage of the earthquakes and reduce uncertainty in the epicenters.
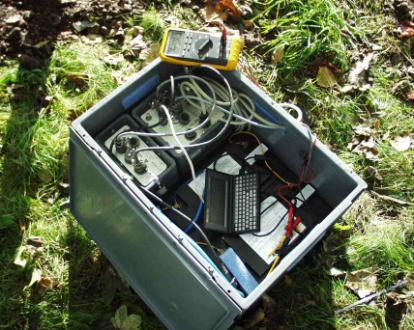
The N.E.R.C. (National
Environment Research Council) Geophysical Equipment pool supplied
the equipment for these stations, consisting of a seismometer (Figure 5) to measure the ground vibrations and
a data logger to record the data (Figure 6). Data are time-stamped precisely using
a GPS clock. Unlike the permanent stations, data from the temporary
stations are not transferred to the BGS offices in Edinburgh in near
real-time and has to be collected manually. Epicenter locations
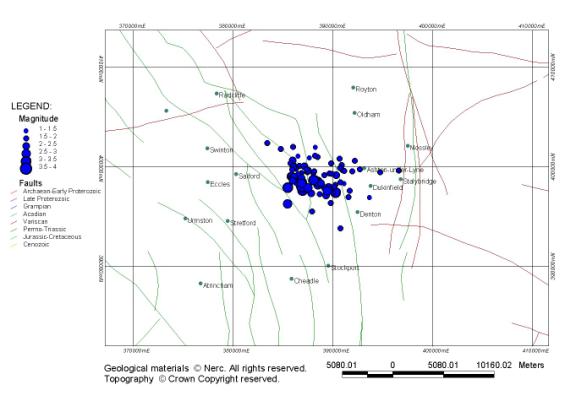
The earthquakes were located using data from the seismograph stations that are located near Manchester, typically within a distance of about 250 km. The arrival times of different seismic waves at each station (seismogram plot) are fed into a computer program that uses an inversion method to find the best-fitting hypocenter (location and depth) for the observed data. Generally, however, this procedure does not resolve the true exact location. Instead, the routine provides a result with an uncertainty, which means that the event is expected to have occurred within an ellipsoidal shaped volume around the solution. In case of the Manchester earthquakes, the uncertainty in the epicenter (projection of location onto the Earth surface) and the event depth is of the order of about 2 km. This makes it generally difficult to link smaller earthquakes to existing faults, especially at depth. The comparison of the seismograms between various events indicates that the events are probably located much closer in space than resolved through the location procedure so far. The locations of the Manchester earthquakes are plotted in Figure 7. Distribution over time
Figure 8 shows how
the Manchester earthquake activity has changed since it started on
October 19. The number of events increased fastest in the period October
21 to October 24, which is reflected by the high slope in the plot
of cumulative number. Since then the activity has slowed down, which
is seen in the flattening of the cumulative number of events. At the
same time it appears that the largest events in the sequence were
observed before October 25. However, the activity is still continuing
and it is unclear when it will stop. The cumulative energy plot shows
that most of the energy was released in the double event of the two
largest earthquakes on October 21. Felt effects
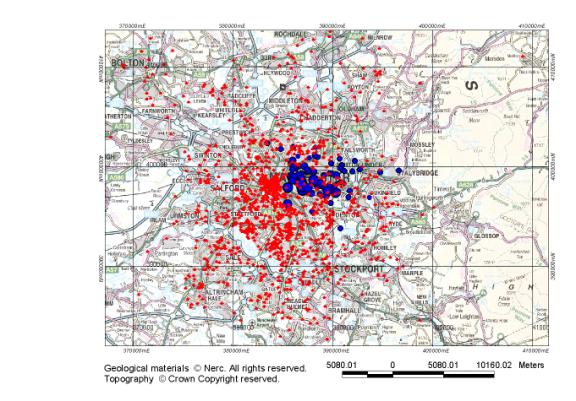
The BGS received more than 3000 reports by people who have felt the Manchester earthquakes. The locations from which reports were received are shown in Figure 9. Most of the reports are from within 20 km from the Manchester Cite Center. The maximum intensity of 5+ on the European Macroseismic Scale (EMS) was obtained for the event on October 21 at 11:42. People described their experience
of events as follows:
Minor damage reports of small cracks,
falling tiles, shattered windows, falling rubble and plaster were
received. The intensity 5 according to the
EMS is described as:
Geology
Geologically, the
Manchester and Salford area straddles the southern part of the Carboniferous
South Lancashire Coalfield and the northern part of the Permo-Triassic
Cheshire Basin. The coalfield has been extensively worked from numerous
collieries, including Patricroft, Bradford and Agecroft in the north
Manchester city area. Coal mining ceased in this part of the coalfield
in the late 1970s. The northeastern margin of the Cheshire Basin is
heavily faulted. The throw of individual faults at the basin margin
varies from tens of metres to over 1000 m. Coals that were worked
from Bradford Colliery are in a fault block bounded to the north and
east by the Bradford Fault. The Permo-Triassic rocks comprise the
Sherwood Sandstone Group, which is the second most important aquifer
in the UK. Source Mechanism
Due to the movement
of the tectonic plates, stresses build up within the Earth crust (the
upper 35 km). The UK is on the Eurasian plate and receives compressional
stresses due to the ridge-push force generated by the Mid-Atlantic
ridge in the North Atlantic. These stresses are released through motion
on pre-existing faults when the structure can no longer resist the
stresses. This relative motion of the fault blocks is what happens
during the earthquake. From the seismic data it is possible to identify
the orientation of the fault and the direction of slip. This information
is useful for identification of the fault on which an earthquake has
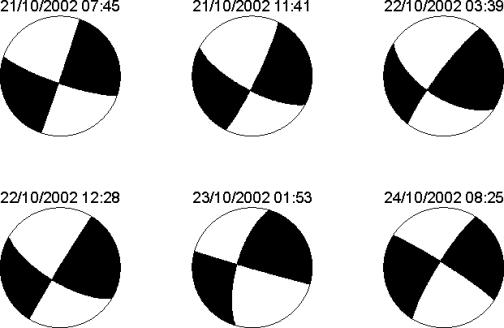
occurred. For the six largest
events of the Manchester sequence, the source mechanism was determined
based on the first motion polarities and the amplitude ratio of P
and S waves. Figure 10 shows the fault plane solutions that were obtained.
The six solutions are rather similar and basically strike-slip solutions.
There are always two fault planes that explain the observed data equally
well, and additional geological knowledge is required to identify
which is the true fault plane. For Manchester, most of the faults
in the epicentral area are oriented NW-SE, which therefore may appear
to be the most likely candidate. At the moment it
is probably still too early to identify the fault of the earthquake
sequence. Improvement of the earthquake location will be achieved
through joint hypocenter location and use of data from the temporary
stations. Conclusion
The Manchester earthquake sequence that started on October 19 with more than 70 events due to its� location in an urban environment was experienced by a large number of people. Not surprisingly, the events created an enormous media interest (BGS gave some 60 media interviews). The largest event on October 21 had a magnitude ML 3.9, and thus was only of moderate size at which no significant damage would be expected. The activity appears to be an earthquake swarm, since there is no clear distinction between a main shock and aftershocks. It seems likely that all events in the sequence originate from a relatively small source volume. This is supported by the similarities in source mechanism and waveform signals between the various events. The question on when the activity is going to stop cannot be answered at the moment, however, since October 25 the activity has decreased both with respect to numbers and size. The answer to the question on whether a larger event, following this sequence, is expected is clearly no.
|